Twitter: @rodgermitchell; Search #monetarysovereignty
Facebook: Rodger Malcolm Mitchell
Mitchell’s laws:
●The more federal budgets are cut and taxes increased, the weaker an economy becomes.
●Austerity is the government’s method for widening the gap between rich and poor, which ultimately leads to civil disorder.
●Until the 99% understand the need for federal deficits, the upper 1% will rule.
●To survive long term, a monetarily non-sovereign government must have a positive balance of payments.
●Those, who do not understand the differences between Monetary Sovereignty and monetary non-sovereignty, do not understand economics.
●The penalty for ignorance is slavery.
●Everything in economics devolves to motive.
======================================================================================================================================================================================
In the June 12, 2013 post titled, “This graph predicts the future. What does it tell you,” we showed you this graph:
 The FRED series, Total Credit Market Debt Owed by Domestic Nonfinancial Sectors – Federal Government, is now known as Federal Government; Credit Market Instruments; Liability.
And we asked four questions:
1. What does the federal government do in the years leading up to recessions? (Answer: Cut growth in deficit spending)
2. What does the government do that cures recessions? (Answer: Increase growth in deficit spending)
3. What is the government doing now? (For a clearer picture, the next graph is a closeup of the most recent past)
4. Why is the government cutting deficit spending growth, despite overwhelming evidence this causes recessions? (Because of the false premises that the federal government can run short of dollars, or by creating dollars, could cause inflation.)

——————————————————————————————-
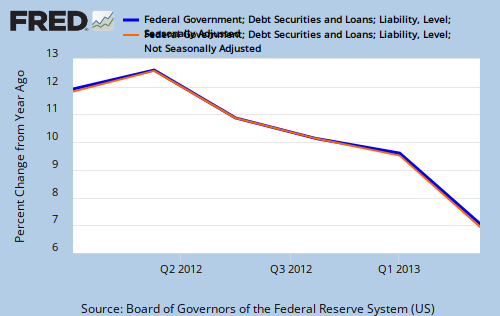
Now another quarter has been posted by the Fed, and the update looks like this:


As growth in federal deficit spending continues to decline, the next recession draws closer.
Rodger Malcolm Mitchell
Monetary Sovereignty
====================================================================================================================================================
Nine Steps to Prosperity:
1. Eliminate FICA (Click here)
2. Medicare — parts A, B & D plus long term nursing care — for everyone (Click here)
3. Send every American citizen an annual check for $5,000 or give every state $5,000 per capita (Click here)
4. Free education (including post-grad) for everyone. Click here
5. Salary for attending school (Click here)
6. Eliminate corporate taxes (Click here)
7. Increase the standard income tax deduction annually
8. Increase federal spending on the myriad initiatives that benefit America’s 99% (Click here)
9. Federal ownership of all banks (Click here)
—–
10 Steps to Economic Misery: (Click here:)
1. Maintain or increase the FICA tax..
2. Spread the myth Social Security, Medicare and the U.S. government are insolvent.
3. Cut federal employment in the military, post office, other federal agencies.
4. Broaden the income tax base so more lower income people will pay.
5. Cut financial assistance to the states.
6. Spread the myth federal taxes pay for federal spending.
7. Allow banks to trade for their own accounts; save them when their investments go sour.
8. Never prosecute any banker for criminal activity.
9. Nominate arch conservatives to the Supreme Court.
10. Reduce the federal deficit and debt
![]()
No nation can tax itself into prosperity, nor grow without money growth. Monetary Sovereignty: Cutting federal deficits to grow the economy is like applying leeches to cure anemia.
Two key equations in economics:
1. Federal Deficits – Net Imports = Net Private Savings
2. Gross Domestic Product = Federal Spending + Private Investment and Consumption – Net Imports
THE RECESSION CLOCK

As the federal deficit growth lines drop, we approach recession, which will be cured only when the lines rise.
#MONETARY SOVEREIGNTY

Hey Rodger, what am I missing here?
if T-bonds outstanding in 2008 were $11T
and T-bonds outstanding in 2009 were $12.4T
why is the T-bonds outstanding yoy change 35% and not 1.4/12.4= 11.3%?
LikeLike
Not sure that I understand your question, but I’ll take a guess: The graphs in the post show quarterly data. Quarterly data doesn’t directly translate into annual data.
Here’s a comparison: Blue line is annual; red line is quarterly:
http://research.stlouisfed.org/fredgraph.png?g=niX
If that doesn’t answer your question, you might wish to ask the St. Louis Fed, and let me know what they say.
LikeLike
Rodger, following was a response on Huffpo to “why won’t stubborn Dems just compromise with GOP demands?” I know you already agree.
the compromise of totally eviscerating what is left of the US economy by artificially putting us on the same basis as Eurozone countries which must rely on foreign currency the Euro, the EU, the ECB and on Bond Market
— USA is not on that kind of system unless Congress willfully abandons the Dollar —
that’s not a good compromise.
Conservatives would LIKE to abandon our powerful Free-Floating Sovereign Currency which allows Americans a wide breadth of economic freedom from Global Banksters, and force America to kowtow to the Bond Market. Why? They constantly argue and hype FALSELY that we ARE on that basis now.
prediction: THEY WILL.
Within a decade or two, Right Wing is inventing a “populist” and “patriotic” mindset to have us lose all confidence and faith in the American Republic and the U.S. Dollar.
Nothing is REALLY wrong, only politics and nonsense. The hoax of the Debt Ceiling and $17 T National Debt (OMG too much private wealth?) can be leveraged politically to get Americans to willfully joyfully surrender our Dollar and place ourselves directly under the yoke of Bond Vigilantes for total economic slavery, like Greece.
Loudest voices against existence of the Fed and “Jewish bankers” and for “free market banking” are the same ones constructing that noose of “totalitarian libertarianism”. Journey into a Libertarian Future on Naked Capitalism.
LikeLike
Extremists demand compromise, because any compromise moves closer to the extreme.
Those in error demand compromise, because any compromise moves closer to error.
The earth circles the sun. No, the sun circles the earth. Let’s compromise.
LikeLike
Rodger, do you think I’m trying to be obstinate? I love your site, I’ve bought your book, I’ve commented here many times before, I’m not dannyboy, bapoy, flash, etc. I am simply trying to understand the nature of the graph, I’;m not at all saying that it or you are wrong.
With all that said, your reply didn’t help at all. Where is the miscommunication in my question? I love this graph, intuitively it makes sense but if I use it in my own posts to make the same point, I should probably understand it. And right now, I just can’t seem to grasp how an 11% increase in the number of T-bonds from one year to the next can translate into a 35% YOY change. Please help. If you still don’t understand my question, could you please try and further explain what you don’t understand about it, so that maybe I can better formulate the question next time, if necessary.
LikeLike
Not accusing you of anything. Just don’t know where your numbers come from. Where are the 11% and 35% figures?
LikeLike
the 35% figure comes from the graph you provided. In the most recent peak during the 2008\2009 recession. That peak tops out at 35% yoy change.
The deficit in 2009 was $1.4 trillion, and the T-bonds outstanding at the beginning of Obama’s 1st term were ~$11 trillion. So after one year of deficits totaling $1.4 T, that means the T-bonds increased from $11 T to $12.4 T. An increase of 11%, not the 35% thats displayed on the graph above. Obviously, something in my analysis and understanding of the graph is wrong, hence the disparity and my asking the question in the first instance.
LikeLike
Auburn,
One observation on your calculation year over year, the 1.4 trillion should be divided by the starting number, 11 trillion, NOT 12.4 trillion. Additionally, looking at the level of debt may be a bit confusing, since it does not reflect principal and interest.
Based on the chart posted by Roger, spending growth looks something like this on a yearly basis (compared to prior year):
2006 – 4800
2007 – 5100 (6.25% growth)
2008 – 5600 (9% growth)
2009 – 7600 (35% growth)
On a quarterly basis (compared to same quarter prior year), it looks like this:
Q1-2008 300 (50.00% growth)
Q2-2008 380 (100.00% growth)
Q3-2008 600 (200.00% growth)
Q4-2008 1200 (313.79% growth)
Q1-2009 1450 (383.33% growth)
Q2-2009 1900 (400.00% growth)
Q3-2009 1700 (183.33% growth)
Q4-2009 1500 (25.00% growth)
The key to understanding Roger’s chart is that the lines represents the RATE of increase in spending, meaning, how much more did we spend year over year. I added a 10% yearly growth on top of the 35% starting in 2011 (which in Roger’s opinion would be insufficient as he wants growing deficit RATES year in and out), and the debt would have hit 38 trillion by this year (2013). It would hit 240 trillion by 2016. Quite honestly, I am 100% sure this is not possible whether we are sovereign or not.
LikeLike
Dannyboy,
As Galbraith, Mosler, Wray and others have pointed out, the “debt” is not the source of spending and need not exist at all.
Congress’ current mandate is that Tsy must sell bonds to domestic and foreign banks to acquire a +balance of Federal Reserve Notes.
Obviously, Tsy could get Federal Reserve Notes from the Fed in exchange for Tsy Notes (Bonds etc.), if Congress didn’t forbid that relationship, as a free gift to Primary Dealers.
Randy Wray suggested just that in one article. DON’T raise the debt ceiling. Instead, let current outstanding T-Bonds run to maturity and revert back to cash. Change the rules to allow the Treasury to make those final interest payments per contract. The rules change would be far less than the what was done in the Financial Modernization Act and similar rules to unleash Derivatives Bets by making them legal business contracts fully enforceable in court … a subsidy of services to the financial markets … and unprecedented in the entire history of human monetary existence.
That would be a LOSS of PROFITS to the Big Banks, on virtually no-risk US Govt Securities.
That need not impede the Govt in any way from providing for Defense, Soc Sec, direct corporate welfare, or indirect corporate welfare thru designated “poor people”.
Also, to conduct monetary policy, then the Fed would have to pay interest directly on Reserve balances, but that is not part of the “budget” or “debt” of the Govt, and not directly controlled by Congress.
Various other scenarios are plausible to sidestep this clusterf__k that is based on archaic rules, faulty understanding of monetary and accounting SEMANTICS about national debt (which is private savings stored in US govt accts), and most likely a combination of ignorance and the desire to destroy the Middle Class completely, and probably to turn America over to rule by Bond Vigilantes instead of sovereign.
That said, sure it would not be a problem for the Govt to issue those levels of Govt Debt, if that’s what banks and savers wanted to save in T-Bonds.
But no one in MMT has suggested that it would be wise to FLOOD the economy with Dollars faster than business and jobs can absorb those Dollars via real expansion. Nor does MMT suggest that a booming economy with high and yet sane (not Asset Bubble) growth in bank lending must continue to maintain extremely high levels of Govt “adds” to the money supply. The “adds” to the domestic money supply (deficit spending) are mostly aimed at times when BANKS are contracting or not sufficiently expanding credit-money at a steady rate as they normally do in the sane phases of a growing economy, at times when capacity of Labor and capacity of Business and/or production is vastly under-utilized.
The Recession is costing some $3 Billion per day (estimate mentioned by Mosler) in lost output. That’s not a loss of “worthless fiat currency” like the $46 Trillion the news was bantering about with the Shutdown, that’s a loss of REAL physical tangible wealth, advancements in technology, and humans sitting on the sidelines for years, which is LOST FOREVER.
LikeLike
Auburn,
T-security sales and deficits do not move in lockstep. See: http://research.stlouisfed.org/fredgraph.png?g=nke
(“FYFSD” = the federal deficit, figured annually)
T-security sales are based on the Fed’s predictions about deficit spending, and are of various time lengths — 1 year, 2 year, 10 year — and they occur in bunches, rather than daily.
Deficits are in real time and always are for the present.
Consider if you were the Fed. How many T-bills would you offer at the next auction? How many T-notes? T-bonds?
LikeLike
Hey Rodger, I see what you’re saying, and most likely I’m just too dense to understand, but I still can’t grasp where that 24% disparity comes from in 2009. Again, I’m not some conspiracy nutter that thinks the data is all lies. I just hate cognitive dissonance and having to answer “I don’t know”. As I said, I would love to use this graph to make the obvious point about decreasing deficits leading to recessions, but I cant in good conscience use something I don’t understand. That would be intellectually dishonest of me. And avoiding hypocrisy is the key to a moral life, IMHO.
LikeLike
“decreasing deficits leading to recessions”
Simply as I understand it,
The size of the supply of “money in circulation” includes those bank deposits that banks issue (create) as loan proceeds which circulate “as money” for the life of the loan.
So long as post-Collapse aggregate bank-credit is stagnant or contracting (winding down debt is also called “net saving” in the private sector), that is a figure that is going towards reducing the sum of dollars “in circulation” in the private sector.
That’s a HUGE chunk of consumer and business DEMAND.
A falloff of Demand *IS* a Recession.
If America could somehow magically rollback our Labor, Industry, Production to the situation the 1920s — while keeping 2013 asset, housing, energy, and other prices, which makes that rollback impossible without catastrophic collapse of the entire society — then as a net EXPORTER a federal budget deficit could smaller or non-existent.
But the major business and political interests in America are vehemently opposed to doing anything at all to reduce our Net IMPORTER status, such as the Chamber of Commerce, even when that change suggested is TAX CUTS aimed at domestic US businesses.
Since the USA is a NET IMPORTER, we get valuable tangible goods like tires, iPods, laptops, flatscreens, everything, and all we have to exchange for this is Account Credits at the Fed denominated in what conservatives who hate America now call “worthless fiat currency” (but none of them have offered to send me all their worthless junk dollars). But in exchange for all that fancy cheap stuff, the US economy loses a huge chunk of that “worthless fiat currency” (which the US Govt has a monopoly on creating).
If Uncle Sam doesn’t replace that “worthless fiat currency” by running a budget deficit, then simple arithmetic says that the combination of net savings (debt rolldown) and net imports will result in a shortage of “worthless fiat currency” money that we need in our domestic economy, or else we suffer a RECESSION.
Particularly since the downward spiral means we in aggregate cannot pay debts we have previously incurred on business or housing or whatnot, so we end up in a combination of bankruptcy and debt peonage just to try to stay afloat.
Neoclassical economics textbook version writes money and banking and private debt out of the picture completely, as a “veil” over even-steven “equilibrium” barter — check Steve Keen on that — which means this HUGE factor of private sector credit-money creation — which is not merely being an intermediary between savers and borrowers, patient vs impatient — is completely missing from the Neoclassical paradigm.
Any surprise that they couldn’t see that the Credit Bubble which was generating some “economic growth” along with asset inflation MUST lead to a catastrophic collapse of “growth” as well a financial collapse — unless the Govt steps in to protect the economy from the financial tsunami?
LikeLike
Rodger,
I do, like you often do, try to explain this stuff in THEIR right wing (or liberal-right) paradigm (a) because using common vernacular even if it’s nonsense probably clarifies and (b) it’s FUN!!!
LikeLike
Dannyboy, thats all wrong. What it must be to live in a right wing world. Seriously, doesn’t it bother you that reality in no way comports with your opinion of it? Thats so much drivel and nonsense.
LikeLike