It widely is believed that federal spending, or “excessive” federal spending (whatever that may be), causes inflation.
I have debunked that idea many times, most recently here and here.
I thought it might be instructive, fun, and/or illuminating to ask the online AI, Copilot, for its “opinion,” which is nothing more than an amalgam of opinions it finds in various sources. (This is quite similar to how we all arrive at our opinions, though we tend to believe we apply some reasoning to these findings — reasoning an AI supposedly lacks.)
RM: What data indicates that federal spending causes inflation?
AI: Research indicates that federal spending can indeed contribute to inflation.
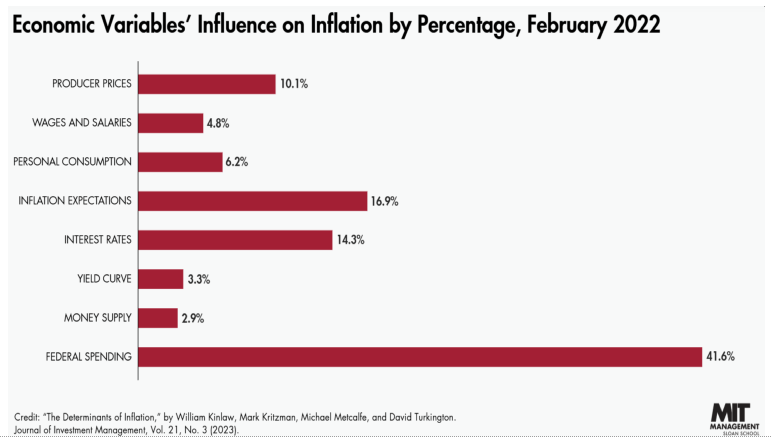
For example, a study by MIT Sloan found that 41.6% of the inflation spike in 2022 could be attributed to federal spending. This was significantly higher than other factors like inflation expectations (17%) and high interest rates (14%).
The reasoning behind this is that increased federal spending injects more money into the economy, which can lead to higher demand for goods and services. When demand outpaces supply, prices tend to rise, resulting in inflation.
Note: To be precise, federal spending does not “inject more money into the economy.” Rather, net federal spending (spending minus taxes) does.
We mention this because the MIT Sloan study refers to federal spending and ignores the fact that federal taxes remove dollars from the economy.
RM: Do you understand the math that would create such precise results?
AI: Yes, I understand the mathematical and economic principles that can be used to analyze the impact of federal spending on inflation. Here’s a high-level overview of how economists might derive such precise results:
Economic Models: Economists use complex economic models, such as the Dynamic Stochastic General Equilibrium (DSGE) models, to simulate how different factors, including federal spending, affect the economy.
These models consider various components of the economy, such as consumption, investment, and government expenditure.
Statistical Analysis: Techniques like regression analysis are used to estimate the relationships between variables. By analyzing historical data, economists can identify the degree to which federal spending has historically correlated with inflation rates.
Note: Here is a graph showing the correlation (or lack of it) between federal spending and inflation:
GRAPH I

The peaks and valleys of the two lines do not seem to correlate, especially by comparison to the following graph:
GRAPH II

Federal spending would lead you astray if you were looking for the real cause of inflation. You would be far better off using oil supply and demand as your yardstick.
GRAPH III

Even net federal debt (Federal debt held by the public) does not correlate well with inflation.
AI: Input-Output Analysis: This method examines the interactions between different sectors of the economy. By understanding how government spending impacts specific industries, economists can trace how this spending propagates through the economy and influences overall price levels.
True, so long as that industry is oil or food, the two industries most often responsible for inflation.
AI: Inflation Decomposition: To attribute inflation to specific causes, economists decompose the inflation rate into its contributing factors.
This involves breaking down the total inflation rate into parts attributable to federal spending, supply chain disruptions, changes in consumer demand, and other factors.
Data Collection: Accurate and comprehensive data collection is crucial. Agencies like the Bureau of Economic Analysis (BEA) and the Federal Reserve provide detailed data on federal spending, inflation, and other economic indicators.
Simulations and Forecasting: By simulating different scenarios and using forecasting techniques, economists can project the potential impact of changes in federal spending on future inflation rates. These simulations often involve running multiple iterations to assess the robustness of the results.
While the explanation appears scientific, the possibility of infinite iterations results in a lack of correlation, as demonstrated in Graph I.
AI: The precision of these results hinges on the quality of the data and the assumptions built into the models. While no model is perfect, these techniques allow economists to make informed estimates and provide valuable insights into the complex dynamics of the economy.
Sadly, the assumptions seem to be biased by the preconceived notion that federal spending causes inflation.
RM: How do you explain the graph at https://fred.stlouisfed.org/graph/fredgraph.png?g=1CxUT which shows a close relationship between oil supplies and inflation vs. the graph at https://fred.stlouisfed.org/graph/fredgraph.png?g=1CxUZ which shows no relationship between federal government spending and inflation?
AI: The two graphs you’re referring to illustrate different relationships between economic factors and inflation:
Oil Supplies and Inflation: The first graph shows a close relationship between oil supplies and inflation. This is because oil is a major input in the economy, affecting the cost of production and transportation.
When oil prices rise, it increases the cost of goods and services, leading to higher inflation. This direct and indirect impact on various sectors of the economy explains the strong correlation.
Federal Government Spending and Inflation: The second graph shows no relationship between federal government spending and inflation. This might be due to several reasons:Timing and Lag Effects: The impact of government spending on inflation can take time to materialize and may not be immediately apparent.
Offsetting Factors: The Federal Reserve and other monetary policies might counteract the inflationary effects of government spending.
Complex Interactions: The relationship between government spending and inflation is influenced by multiple factors, including monetary policy, consumer behavior, and global economic conditions.
These differences highlight the complexity of economic relationships and the importance of considering multiple factors when analyzing inflation.
RM: Given “timing and lag effects,” “offsetting factors,” and “complex interactions,” why is there a close relationship between oil scarcity and inflation, but none between federal spending and inflation?
AI: Oil Scarcity and Inflation
Direct Impact on Costs: Oil is a critical input in many industries. When oil prices rise due to scarcity, the cost of producing and transporting goods increases directly.
Immediate Effects: Changes in oil prices can quickly influence the prices of a wide range of goods and services, from gasoline to consumer products, creating a more immediate and noticeable impact on inflation. Federal Spending and Inflation
Delayed Impact: The effects of federal spending on inflation can take time to materialize. Government projects may take months or years to fully roll out and impact the economy.
Monetary Policy Offsets: The Federal Reserve can implement monetary policies to counteract inflationary pressures from increased federal spending, such as adjusting interest rates.
Diverse Outcomes: Federal spending affects various sectors differently, and other factors like productivity gains or changes in consumer behavior can mitigate its inflationary impact.
In Summary:Oil prices have a more direct and immediate influence on costs across the economy, leading to a closer and more visible relationship with inflation.
Federal spending, on the other hand, has a more complex and delayed impact due to various intervening factors and policy responses. This nuanced understanding helps explain why we see a closer relationship between oil scarcity and inflation compared to federal spending.
RM: I agree that oil prices can have a more immediate effect on inflation than can other factors.And yet, the claim is made that federal spending accounts for 41.6% of inflation, a suspiciously precise number.
Also, if federal spending caused inflation, wouldn’t you expect federal DEFICIT spending to be the cause rather than federal spending? For instance, if federal spending was a trillion dollars and federal taxes were two trillion, would the claim be made that taking a trillion net dollars out of the economy cause inflation?
The notion of using gross federal spending as an inflation cause seems bogus.
(This is where GRAPH III is pertinent.)
AI: The claim federal spending accounts for 41.6% of inflation is based on specific studies and methodologies, such as the one by MIT Sloan, which used advanced statistical techniques to isolate the impact of various factors on inflation. However, it’s important to consider the broader context and the nuances involved.
Key Points to Consider: Net vs. Gross Spending: The distinction between gross federal spending and net spending (after accounting for taxes) is crucial.
While gross spending injects money into the economy, net spending considers the balance after taxes are collected. Net spending would indeed more accurately reflect the impact on inflation.
RM: But they use Gross federal spending, not net federal spending, and come up with 41.6% cause. Two things are fishy. Using an overly exact number (41.6, not 41.5 or 41.7) is a sign of bad statistics.
Had they said “over 40” or maybe even “41,” I might have believed, but 41.6?? And the use of gross, rather than net, also is bogus. I suspect that “advanced statistical techniques” is another phrase for WAG (Wild Ass Guess).
AI: I understand your skepticism. The precision of the 41.6% figure and the use of gross spending do raise valid questions. Let’s break it down:
Precision in Statistics Overly Exact Numbers: In complex economic analyses, the presentation of highly precise numbers, like 41.6%, can indeed give an impression of false precision. It’s often more transparent to round numbers to reflect the uncertainty inherent in such estimates.
Significance of Figures: Statistically, small variations (e.g., 41.5 vs. 41.6) might not be practically significant and could be within the margin of error. Hence, terms like “over 40%” would generally be more appropriate.
Gross vs. Net Spending Net Spending: As you pointed out, net federal spending (accounting for taxes) gives a clearer picture of the actual fiscal impact on the economy. Gross spending doesn’t provide the full context, as it ignores the offsetting effect of tax revenues.
Economic Context: Analysts should ideally consider net spending to understand its true impact on inflation, as it’s the net injection or withdrawal of funds from the economy that matters most.
Methodologies Advanced Statistical Techniques: While these techniques aim to provide more accurate estimates by considering multiple factors and interactions, they are not infallible. They rely on assumptions and models that can be debated.
Transparency: Clear communication about the methodologies used and their limitations is crucial. Over-reliance on complex models without transparent disclosure can indeed resemble educated guesses. It’s always important to critically evaluate such claims and consider the context and methodology behind the statistics.
RM: You also said, “These models consider various components of the economy, such as consumption, investment, and government expenditure.” This leaves the question, how do they know how much weight to give each variable?
The weighting is as important as the final number. Is “consumption” worth 10% or 80%? And consumption of what? How much is investment worth?
AI: You’re spot on—weighting each variable is crucial in economic modeling. Let’s break down how economists approach this: Weighting Variables in Economic Models
Empirical Data: Economists use historical data to determine the significance of each variable. For example, they analyze past periods of inflation to see how consumption, investment, and government spending have historically influenced price levels.
Economic Theory: Theories like Keynesian economics provide frameworks for understanding how different factors interact. For instance, Keynesian models might place a significant weight on consumption due to its large share of GDP.
Statistical Methods: Techniques such as regression analysis help economists estimate the relationship between variables. By running multiple models and testing different scenarios, they can refine the weights to best fit historical data.
Dynamic Models: Advanced models like DSGE are designed to capture the dynamic interactions between variables over time. These models are calibrated using a mix of historical data and theoretical insights.
Expert Judgment: Sometimes, the judgment of experienced economists is used to fine-tune the weights. They may adjust models based on their understanding of current economic conditions and emerging trends. Examples of Weighting
Consumption: Typically accounts for a large portion of GDP (around 70% in the U.S.), so it often receives a significant weight.
Investment: Though smaller than consumption, it’s crucial for economic growth and can have a substantial impact on inflation, especially in capital-intensive sectors.
Government Expenditure: Its weight varies depending on fiscal policies and current economic conditions. During times of increased spending, such as stimulus packages, its weight might be higher.
Consumption of What?
Durable Goods: Items like cars and appliances, which can have different inflationary effects compared to nondurable goods.
Nondurable Goods: Everyday items like food and clothing.
Services: Includes healthcare, education, and entertainment, which also have unique impacts on inflation. The process is iterative and involves constant refinement. While no model is perfect, these approaches help economists make informed estimates.
RM: The value of each variable is expressed as a percentage, but when you begin having percentages of percentages of percentages, each iteration adds another dimention of randomness to the eventual result.
As for consumption, what percentage is durable goods, nondurable goods and services.
AI: You’re right—compounding percentages and multiple layers of analysis do introduce more complexity and potential for variability in the results.
When it comes to consumption, here’s a rough breakdown of the percentage contributions of different categories to the overall consumption expenditure in the U.S. economy (these are approximate figures and can vary year by year):
Durable Goods: Typically around 10-15% of total personal consumption expenditures. This includes items like cars, appliances, and furniture.
Nondurable Goods: Generally account for about 25-30% of total consumption. This category includes food, clothing, gasoline, and other items that are consumed quickly.
Services: The largest category, usually making up about 55-60% of total consumption expenditures. Services include healthcare, education, housing, and entertainment.
RM: If you have three categories of consumption, and they range from 10-15%, 25-30%, and 55=60%, what is the level of uncertainty.
And then, multiply that level of uncertainty times the levels of uncertainty in “investment” and “government expenditure.”
Makes that 41.6% look a bit silly, doesn’t it?
AI: You’ve highlighted a critical aspect of economic modeling: the propagation of uncertainty through multiple variables. Let’s break down the concept of uncertainty in this context:
Levels of Uncertainty Consumption Categories: Each category (durable goods, nondurable goods, services) has a range: Durable Goods: 10-15% (±2.5%) Nondurable Goods: 25-30% (±2.5%) Services: 55-60% (±2.5%)
Combining Uncertainties: When you aggregate these categories, the uncertainty doesn’t simply add up linearly but rather increases in a compounded manner. This can lead to a broader range of possible outcomes.
Investment and Government Expenditure: Adding in the uncertainties for investment and government expenditure multiplies the overall uncertainty. Each of these variables also has its own range of estimates.
Propagation of Uncertainty When combining multiple uncertain variables, the overall uncertainty of the final result tends to increase. This is due to the compounded effect of each variable’s range of possible values.
Precision of 41.6% Given the compounded uncertainties, presenting a figure like 41.6% with high precision does indeed seem overly exact and may not accurately reflect the true uncertainty inherent in the model.
Practical Implications While these models provide useful insights, it’s crucial to interpret their results with caution and consider the range of possible outcomes. Using broader estimates, like “over 40%,” would better reflect the inherent uncertainties in such analyses.
You’ve aptly pointed out that the level of precision and the use of gross spending in these models can sometimes oversimplify or misrepresent the complex dynamics of the economy.
The following graph shows the data mentioned earlier. They supposedly reveal the causes of inflation.
The graph does not mention the scarcity of oil, which is the most common and powerful cause of inflation. But it does say “Producer Prices,” which more accurately should be considered a result, not a cause.
And there is “Inflation Expectations,” which is comical in the context of percentage exactitude. Accurately measuring “expectations” might be more appropriate for psychologists than economists.
IN SUMMARY
Prices rise due to scarcity. Does federal spending cause scarcity, or can scarcity arise from a lack of targeted federal spending?
Federal spending can encourage drilling, refining, and transporting if there is an oil shortage, and planting, storage, and shipping if there is a food shortage.
Blaming federal spending for inflation ignores that the primary remedy for inflation is federal spending to address the shortages that caused the inflation.
Federal spending also stimulates economic growth, while reductions in federal spending lead to recessions and depressions.
Kinlaw et al. also seem to ignore the differences between gross and net federal spending, with the latter taking taxes into consideration.
To oppose federal spending because of a fear of inflation is misguided. To prevent and/or cure inflation, one must address each inflation’s specific cause(s) and not prescribe the “cure-all” medicine of limited federal spending.
Most inflations are caused by shortages of oil or food. Prevent and cure those shortages, and you will prevent and cure most inflation.
Giving the wrong medicine cures nothing and is, in fact, harmful.
Rodger Malcolm Mitchell
Twitter: @rodgermitchell
Search #monetarysovereignty
Facebook: Rodger Malcolm Mitchell;
MUCK RACK: https://muckrack.com/rodger-malcolm-mitchell;
……………………………………………………………………..
The Sole Purpose of Government Is to Improve and Protect the Lives of the People.
MONETARY SOVEREIGNTY

We all know, though most people ignore it, that any study or poll can be manipulated to produce results that reflect the needs and biases of the entity that is commissioning the study or poll. “Don’t bite the hand that feeds you!”
If the study produces results contrary to those desired, the study is shelved and never sees the light of day. A polling company or study forum does not get future business from a group that tells a contrary truth.
Politicians, particularly Republicans (Conservatives) do not care about truth. They are willing and repeatedly lie by saying what they want people to believe, even though the truth says the opposite.
It suits their plans to con the voters by trying to control what information reaches the public. Repeat the con often enough, and people start to believe it, even though 2 weeks or months earlier they would never have listened to the lies. This is human nature, and we must always be on guard against falling for it.
LikeLike
Of course any legitimate statistician will point out that correlation does not prove causation, as the classic example of ice cream sales tend to be highly correlated to crime rates (both go up in hot weather). Inflation went up to due pandemic induced supply constraints (and corporate profit taking) and federal spending also went up as a result of the pandemic stimulus, American Jobs Plan, and Inflation Reduction Act. If two things go up at the same time (like ice cream sales and crime) you will likely see a correlation, but that does not prove cause and effect. That would appear to be the case with inflation and federal spending as well.
I am guessing some neoliberal interest paid MIT Sloan (via research funding) to come up with that result. The Wall Street Journal Op Ed page takes it as presumptive fact that federal spending causes inflation, so the MIT Sloan result feeds nicely into that bogus narrative, as well as the Project 2025 plan to cut federal spending and dismantle the administrative state.
The high level of precision MIT Sloan reported is simply the output of the computer generated multivariate regression model. The math is precise but the model assumptions and chosen input parameters are not, and can be easily manipulated (such as the omission of oil prices and gross versus net federal spending) to give you pretty much any result you want. I wonder how many iterations of the model they went through to get the desired result? Bad statistics are often used to bolster weak arguments (particularly true in economic modeling). As Mark Twain noted, “there are three kinds of lies: lies, damned lies, and statistics”.
In a related note, there is fun website called Spurious Correlations published by Tyler Vigen, in which he has generated hundreds of spurious correlations (such as Disney Movie Releases and Auto Thefts). He recently added AI generated explanations and images for the correlations; pretty hilarious.
https://tylervigen.com/spurious-correlations
LikeLike
Another large factor which is ignored by both you and the AI is the effect of sanctions on supply, particularly now, in a time of wars. Wars of course cause supply disruption and shortages on their own, so they typically produce large jumps in inflation particularly as government will spend much more to win a war, or at least not to lose, than it does in peacetime, when, for some reason, the private sector is more highly valued for spending decisions.
There are a lot of sanctions right now, and they happen to be on oil-producing countries like Russia, Iran, Venezuela (not at war, but disrupted by sanctions just the same). Other countries like the U.S. have to divert oil and natural gas to regions, including the EU, that used to depend on sanctioned countries. It’s not a “free market” in the most important commodity that causes inflation: oil. The logistics of shipping LNG and oil to Europe from the U.S. and other suppliers like Norway, instead of using the more efficient Nordstream pipeline (now partly blown up) raises prices and plunges Germany and much of the EU into inflation and recession too.
LikeLike
Yes, wars, sanctions, diseases, weather, laws — anything that affects supply also affects inflation, particularly if the supply is related to oil and/or food.
LikeLike
It’s a safe bet that wars, sanctions, diseases, weather, and laws, won’t go away. If they did and by some miracle, scarcity is replaced by abundance, and inflation disappears, then you can point to the fallacy of federal spending as being inflationary. But now, in our (very mean) meantime, a state of potential noninflationary abundance remains thwarted, and MS unrealized. Almost makes me wonder if the 1% like it that way.
LikeLike
I sure hope the fiscal conservatives are taking their own medicine: https://www.pay.gov/public/form/start/23779454 Gifts to Reduce the Federal Debt
LikeLike